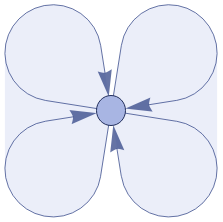
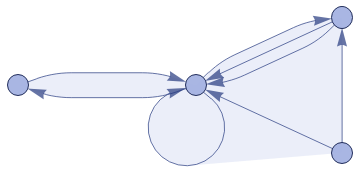
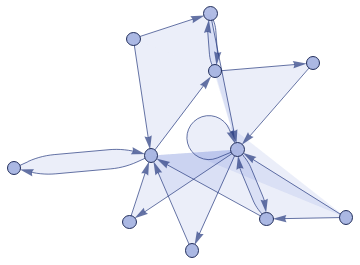
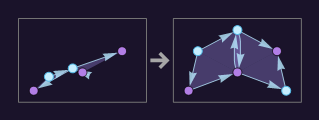
11 steps wm23386wm23386 signature 23→43 rule {{{1, 2, 3}, {4, 2, 5}} -> {{6, 7, 1}, {6, 5, 1}, {1, 7, 3}, {1, 8, 3}}} {{{1, 2, 3}, {4, 2, 5}} -> {{6, 7, 1}, {6, 5, 1}, {1, 7, 3}, {1, 8, 3}}}
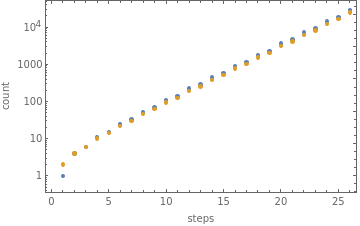
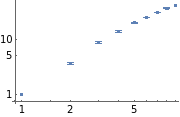
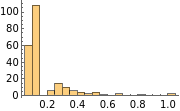
make editable copy download notebook Basic EvolutionBasic evolution:[◼]WolframModel[{{{1,2,3},{4,2,5}}{{6,7,1},{6,5,1},{1,7,3},{1,8,3}}},{{1,1,1},{1,1,1}},6,"StatesPlotsList"],,,,,,Event-by-event evolution:[◼]WolframModel[{{{1,2,3},{4,2,5}}{{6,7,1},{6,5,1},{1,7,3},{1,8,3}}},{{1,1,1},{1,1,1}},<|"MaxEvents"6|>,"EventsStatesPlotsList"],,,,,,Vertex and edge counts:{vertexCountList,edgeCountList}=[◼]WolframModel[{{{1,2,3},{4,2,5}}{{6,7,1},{6,5,1},{1,7,3},{1,8,3}}},{{1,1,1},{1,1,1}},25,{"VertexCountList","EdgeCountList"}];ListLogPlot{vertexCountList,edgeCountList},verticesedgesSymbolic expression for vertex count:FindSequenceFunction[vertexCountList,t]DifferenceRootFunction{y.,n.},-3-2y.[n.]+y.[2+n.]0,y.[1]1,y.[2]4,y.[3]6[t]Symbolic expression for edge count:FindSequenceFunction[edgeCountList,t]12-4+32+t22+1+t(-1)32+t22+3t/22+3t(-1)t/22Result after 11 generations:WolframModel[]["FinalStatePlot"]Causal GraphCausal graph:WolframModel[]"CausalGraph",Rule[]Layered rendering:WolframModel[]["LayeredCausalGraph"]Causal graph distance matrix:MatrixPlotTransposeGraphDistanceMatrixWolframModel[]["CausalGraph"],Final State PropertiesHypergraph adjacency matrix:MatrixPlotAdjacencyMatrix@CatenateMapUndirectedEdge@@@Subsets[#,{2}]&,WolframModel[]["FinalState"],Vertex degree distribution:HistogramValuesCountsCatenateUnion/@WolframModel[]["FinalState"],Neighborhood volumes (ignoring directedness of connections):volumes=[◼]RaggedMeanAroundValues[◼]HypergraphNeighborhoodVolumesWolframModel[]["FinalState"],All,Automatic;ListLogLogPlotvolumes,Effective dimension versus radius:ListLinePlot[◼]LogDifferences[volumes],Successive neighborhood balls around a random vertex: [◼]HypergraphNeighborhoodsWolframModel[]["FinalState"],4,,,Distance matrix:distanceMatrix=GraphDistanceMatrixUndirectedGraph[◼]HypergraphToGraphWolframModel[]["FinalState"];MatrixPlotExp[-(distanceMatrix/.0None)],Distribution of distances in the graph:HistogramFlatten[distanceMatrix],Spreading of EffectsCausal graph adjacency matrix:MatrixPlotAdjacencyMatrixWolframModel[]["CausalGraph"],Neighborhood volumes in causal graph:ListLogLogPlotValues[◼]GraphNeighborhoodVolumesWolframModel[]["CausalGraph"],{1},Other Evolution OrdersRandom evolutions:[◼]WolframModel[{{{1,2,3},{4,2,5}}{{6,7,1},{6,5,1},{1,7,3},{1,8,3}}},{{1,1,1},{1,1,1}},<|"MaxEvents"94|>,"FinalStatePlot","EventOrderingFunction""Random"]Different deterministic evolution orders:[◼]WolframModel[{{{1,2,3},{4,2,5}}{{6,7,1},{6,5,1},{1,7,3},{1,8,3}}},{{1,1,1},{1,1,1}},<|"MaxEvents"94|>,"EventOrderingFunction"{#,"LeastRecentEdge","RuleOrdering","RuleIndex"}]["FinalStatePlot",PlotLabel#]&/@{"OldestEdge","LeastOldEdge","LeastRecentEdge","NewestEdge","RuleOrdering","ReverseRuleOrdering"},,,,,Graph Features of Statesgraph=[◼]HypergraphToGraphWolframModel[]["FinalState"];HistogramClosenessCentrality[graph],Cycle properties:EdgeCycleMatrix[UndirectedGraph[graph]]//MatrixPlotHistogram[Length/@FindFundamentalCycles[UndirectedGraph[graph]]]FindSpanningTree[UndirectedGraph[graph]]