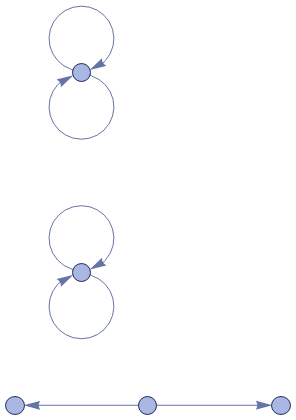
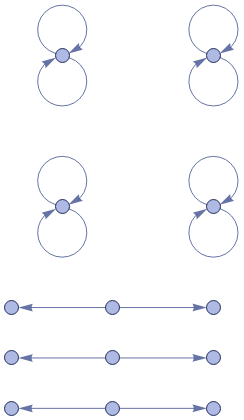
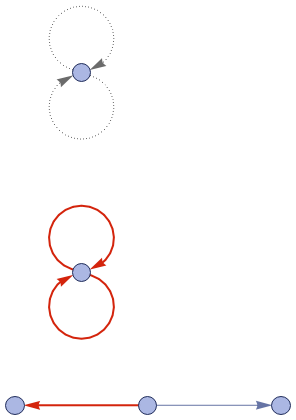
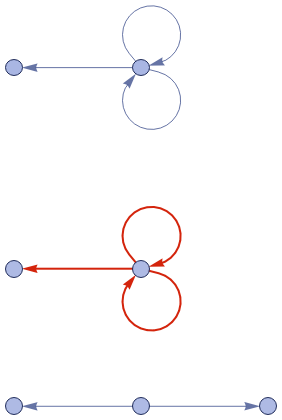
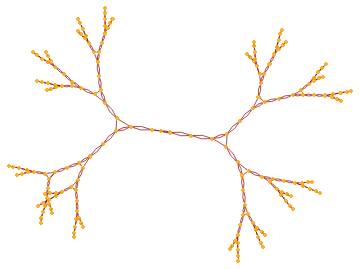
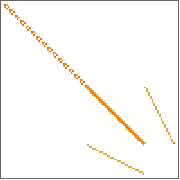
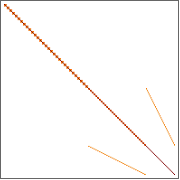
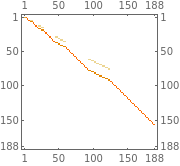
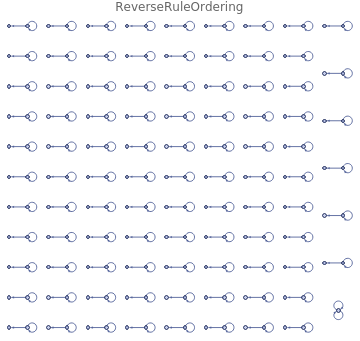
17 steps
wm8386wm8386
signature
22→32
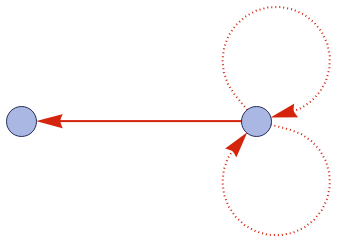
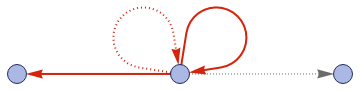
rule
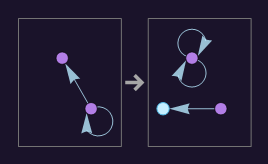
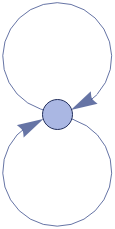
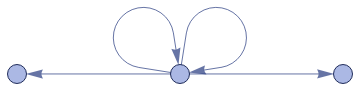
{{{1, 1}, {1, 2}} -> {{2, 2}, {2, 2}, {1, 3}}}
{{{1, 1}, {1, 2}} -> {{2, 2}, {2, 2}, {1, 3}}}
 make editable copy
 download notebook