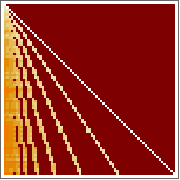
10 steps
wm9473wm9473
signature
32→52
rule
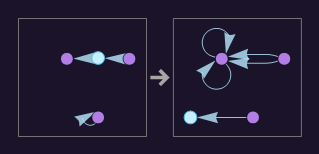
{{{1, 1}, {2, 3}, {3, 4}} -> {{4, 4}, {4, 4}, {2, 4}, {2, 4}, {1, 5}}}
{{{1, 1}, {2, 3}, {3, 4}} -> {{4, 4}, {4, 4}, {2, 4}, {2, 4}, {1, 5}}}
 make editable copy
 download notebook