download pdf
  ARXIV
ARXIV peer review
So far the nodes in our graphs have always been states generated by substitution systems. But we can also introduce nodes to represent the “updating events” associated with replacements performed on strings. Here is the result for evolution according to the rule {AB BAB, BA A} starting from ABA—with each event node indicating the string replacement to which it corresponds:
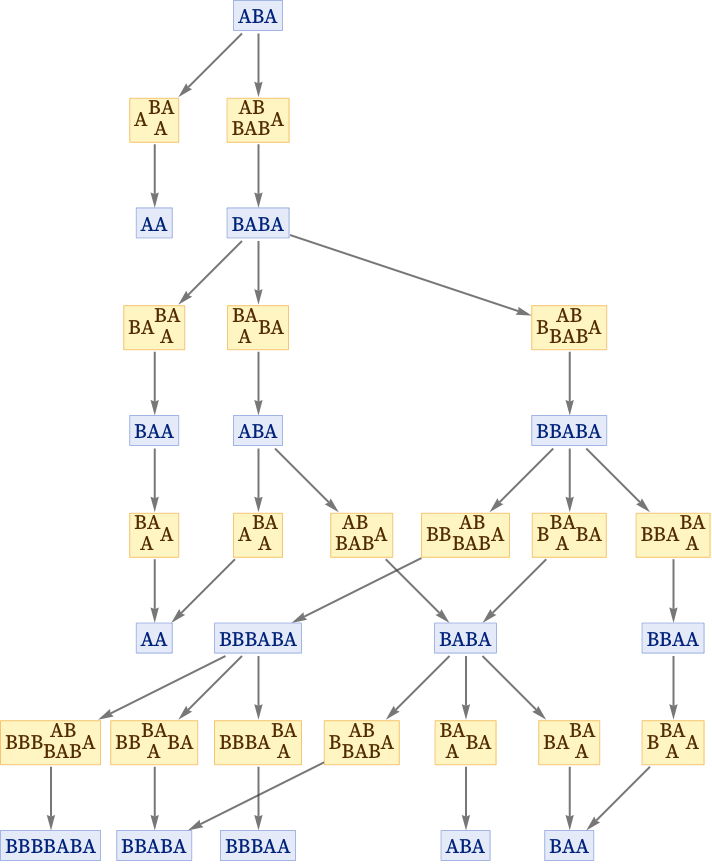
We can also show this as a states graph, where we have merged instances of the same state that occur at different steps:
States are connected through events. But how are events connected? Given two events the key question to ask is whether they are causally related. Does one event depend on the other—in the sense that all or part of its input comes from the output of the other event?
Looking at the graph above, for example, the event ![]() depends on
depends on ![]() because
because ![]() uses as input the A that arises as output from
uses as input the A that arises as output from ![]() . On the other hand,
. On the other hand, ![]() does not depend on
does not depend on ![]() because the BA it consumes was not generated by
because the BA it consumes was not generated by ![]() .
.
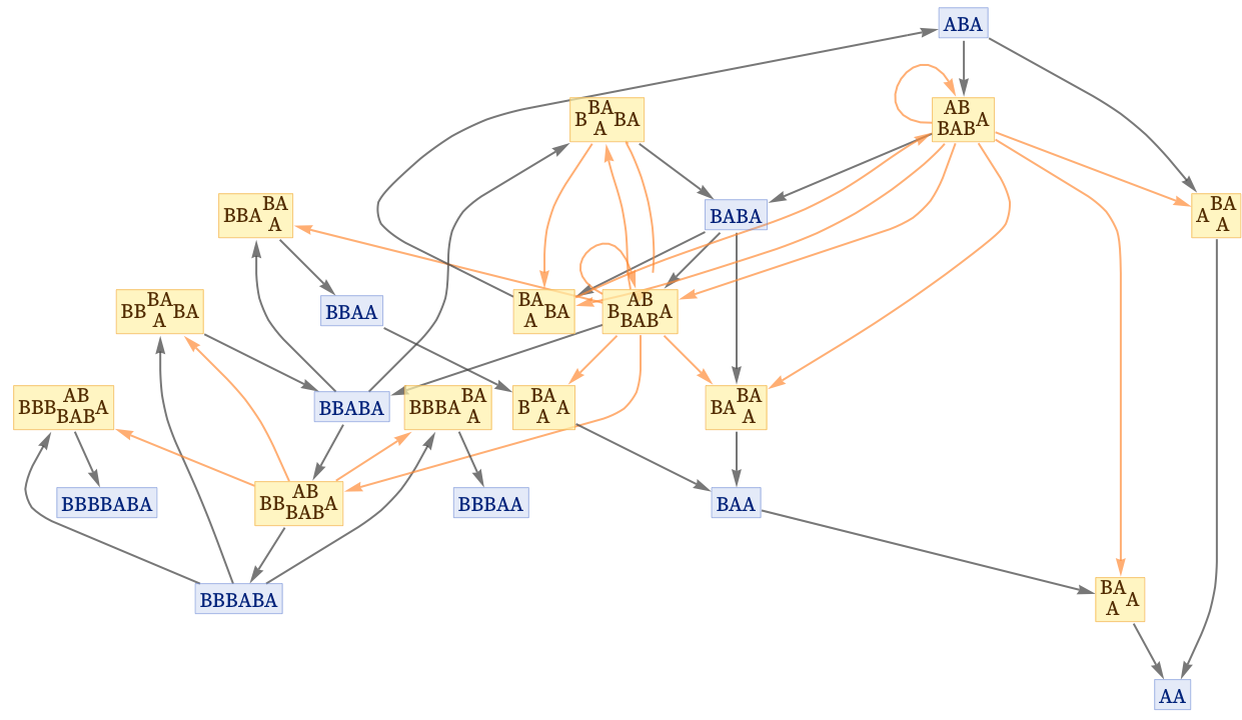
We can add this dependency information to the evolution graph by putting orange lines between events that are causally related:
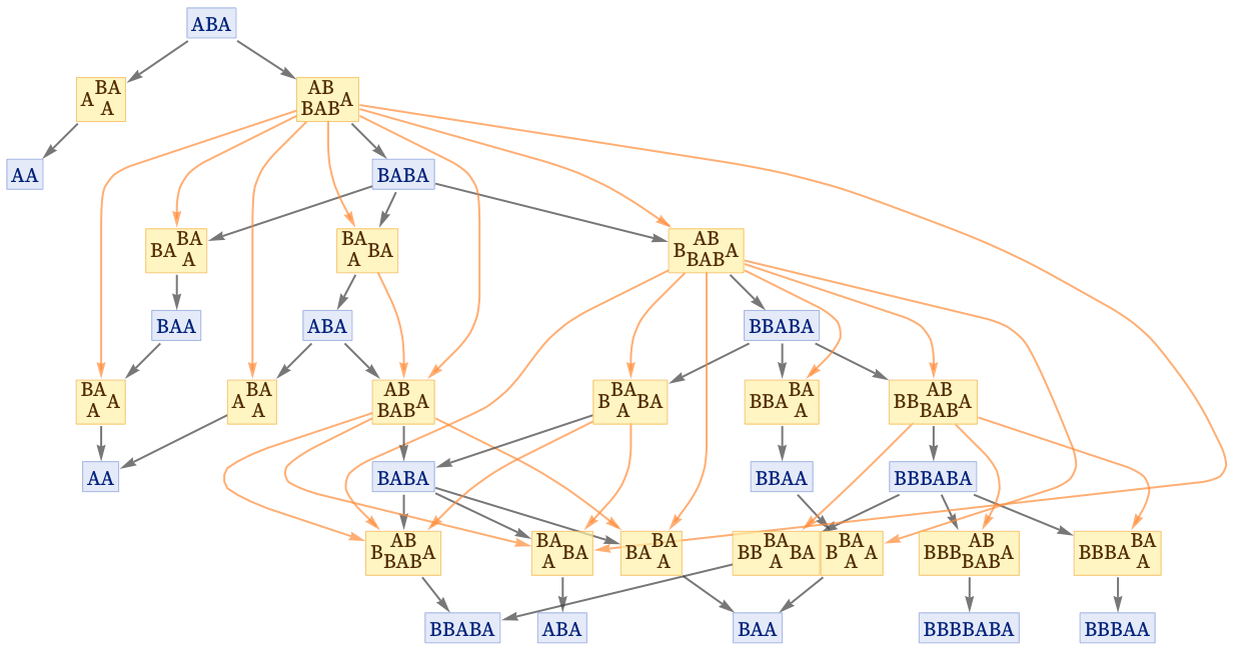
We can also do this in the states graph, in which we have merged instances of states from different steps:
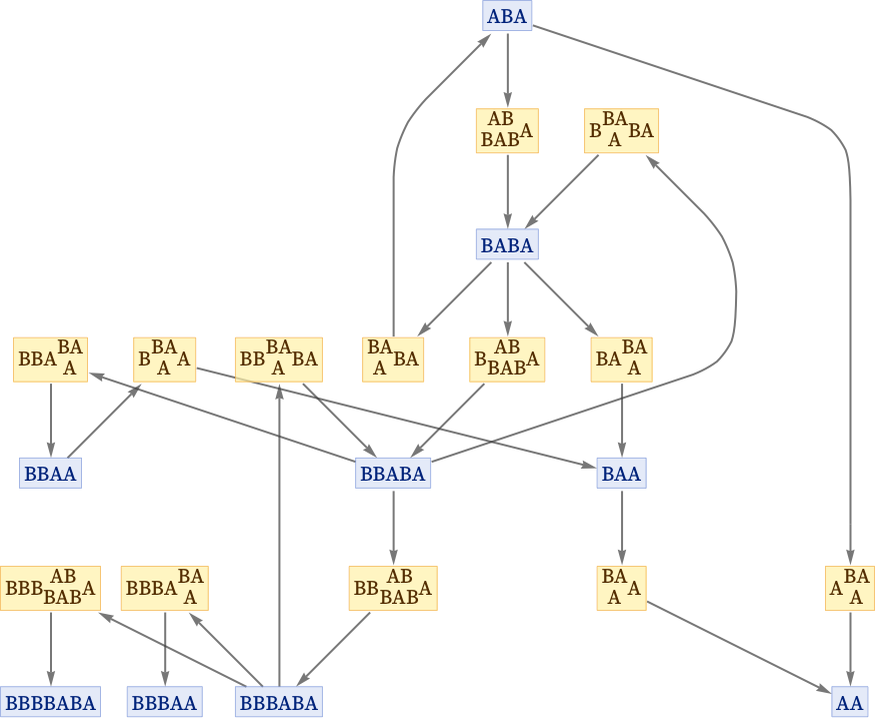
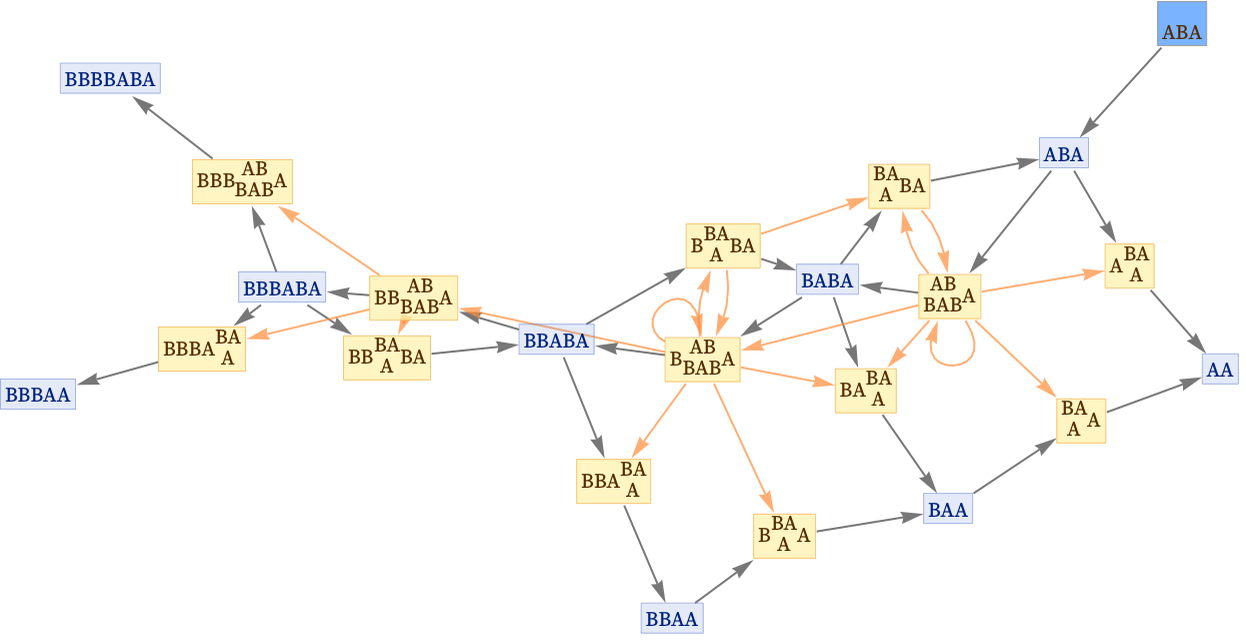
We can redraw this graph without the layering that puts the initial state at the top. We have added an “initialization event” ![]() to indicate the creation of the initial condition:
to indicate the creation of the initial condition:
If we want to focus on causal relationships, we can now drop the state nodes altogether, and get a multiway causal graph that represents possible causal relationships between events:
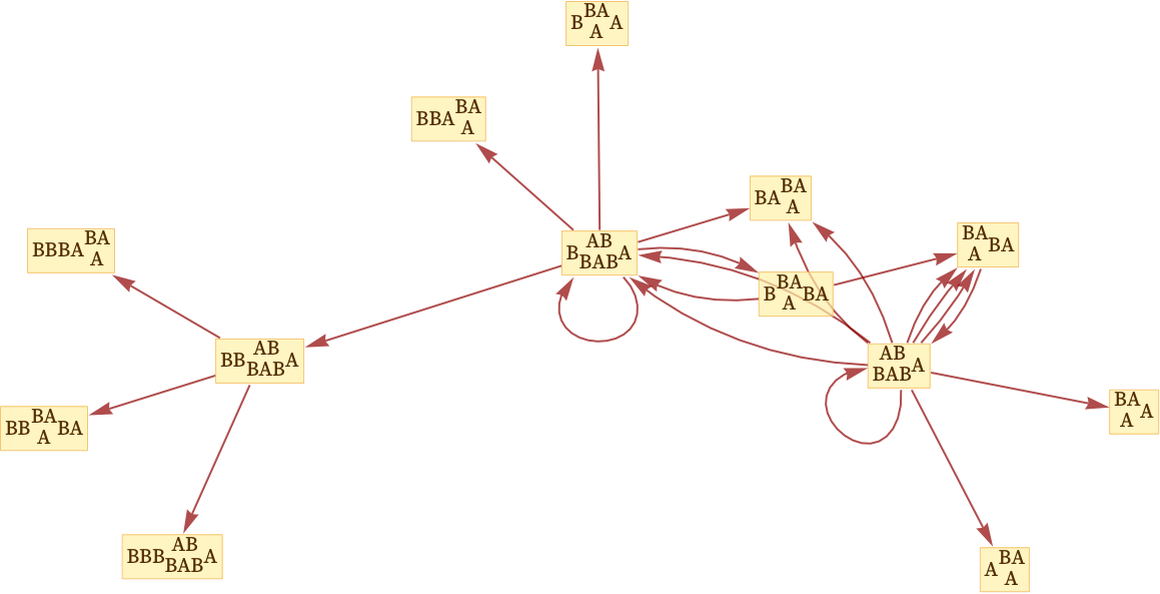
This causal graph is dual to our original evolution graph in the sense that edges in the original evolution graph correspond to events—which now become nodes in the causal graph. Similarly, each edge in the causal graph is associated with some state which appears as a node in the evolution graph.
We can get a sense of “possible causal histories” of our system by arranging the multiway causal graph in layers:
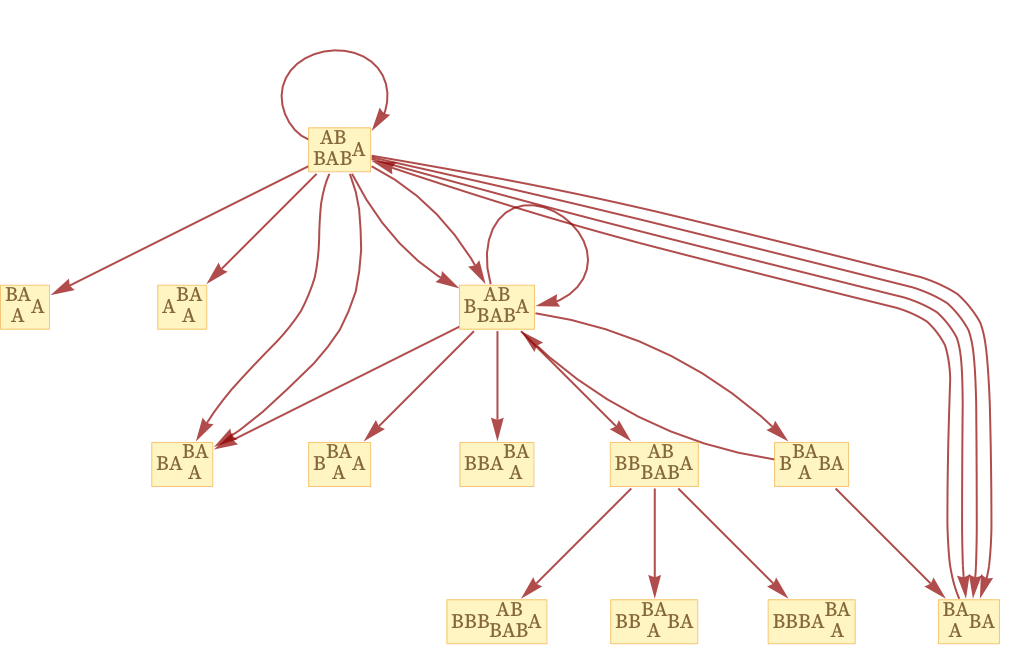
Just like every possible path through the multiway evolution graph gives a possible sequence of states that can occur in the evolution of a system, so also every possible path through the multiway causal graph gives a possible sequence of events that can occur in the evolution of the system.
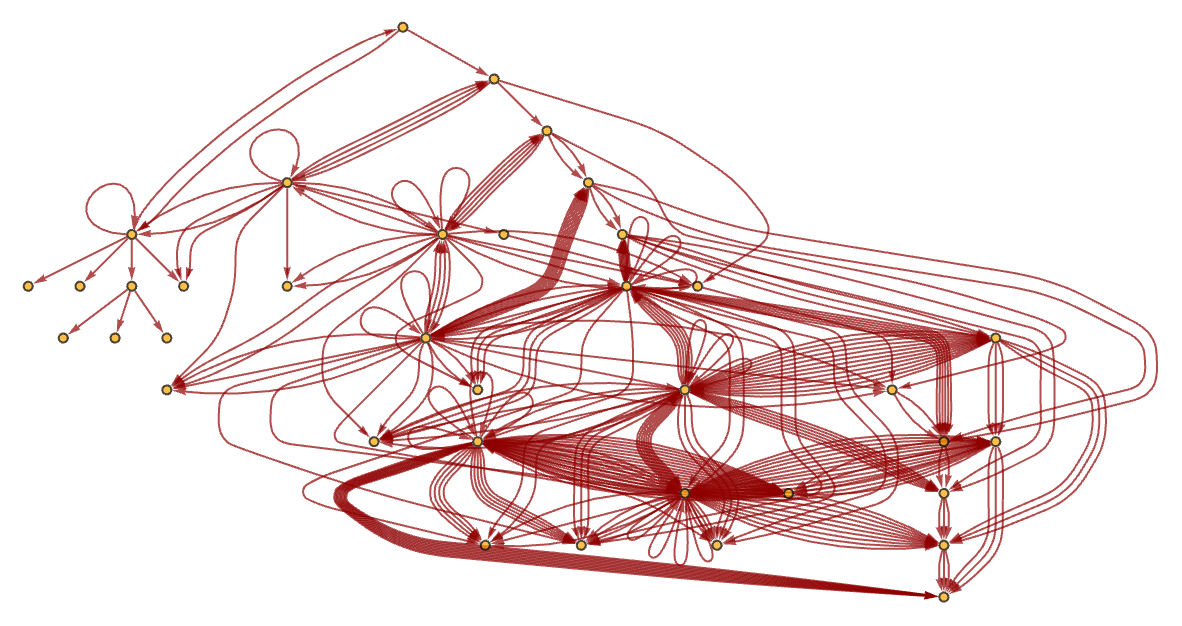
After 10 steps, the graph in our example has become quite complicated: